Reviewing the 2023 National Violent Crime Statistics
It’s time for my annual update on crime statistics, following the September release of 2023 numbers by the Federal Bureau of Investigation (FBI) and the Bureau of Justice Statistics’ National Crime Victimization Survey (NCVS). We also have preliminary numbers on homicides in 2023 from the Centers for Disease Control and Prevention (CDC). Data sources are listed at the end of this post along with my comments on data quality; see Lohr (2019) for detailed descriptions of crime datasets.
Homicide
Statistics in the FBI Crime Data Explorer are calculated from data submitted by law enforcement agencies; for 2023, 16,334 law enforcement agencies covering 94.3 percent of the population submitted data, and the FBI used standard weighting techniques to account for crimes occurring in the remaining 6 percent of the population (see Data Sources section). From 2022 to 2023, there was a 12 percent drop in the homicide rate (the estimated number of homicides per 100,000 population).* Figure 1 shows that reduction in context of trends from 1990 to 2023. The lower line in Figure 1 is the estimated number of homicides per 100,000 population from the FBI. The largest one-year increase in homicide in recent years occurred in 2020, and 2023 marked the largest one-year decrease.
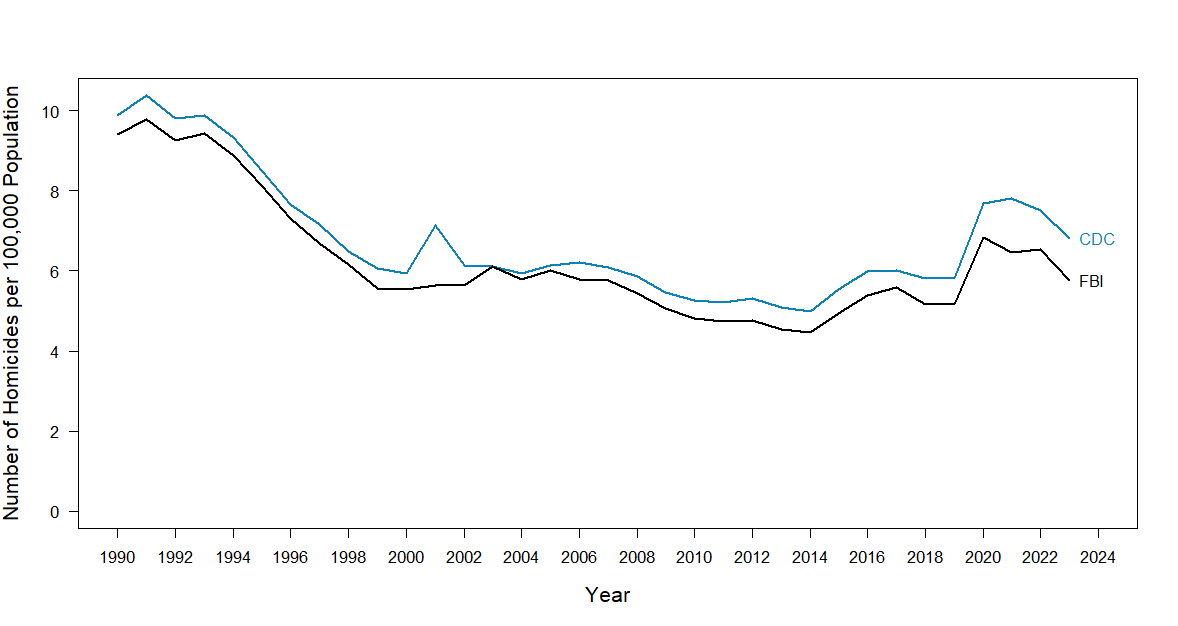
Figure 1. Homicide rates from the CDC and FBI, 1990-2003. See the Data Sources section for comments on how these statistics are calculated.
The upper line in Figure 1 is number of homicides per 100,000 population from the CDC’s National Vital Statistics System. These statistics are calculated from information in death certificates, where deaths resulting from assault are classified as homicides. The CDC rates for 2022 and 2023 are provisional (they may change slightly as more data come in, but typically the provisional rates are close to the final rates). We do not expect the two sources to have exactly the same numbers of homicides since they use different classification criteria — the CDC includes intentional and negligent homicides as well as deaths from terrorist attacks (responsible for the 2001 spike), while the FBI includes only intentional deaths from murder and non-negligent manslaughter — but in general the two sources show similar trends.**
The two sources tell the same story of a dramatic decrease in homicide rates from 2022 to 2023. The FBI data show a 12.0 percent decrease in homicide rate, and the CDC data show a 9.3 percent decrease. Both sets of homicide statistics are approaching pre-pandemic levels from 2019.
Violent Crime Excluding Homicide
There are two national sources of information on violent crime other than homicide. The FBI statistics from Table 1 in “Crime in the United States” (see Data Sources section) provide information about rape, robbery, and aggravated assault from law enforcement agencies.
The NCVS provides crime statistics calculated from a probability sample of US households. Persons aged 12 and older in the sampled households are asked about details of victimizations that happened to them (including whether each incident was reported to the police). The NCVS thus includes crimes that are not reported to the police as well as those that are reported to the police. Crime types and definitions differ for the NCVS and FBI statistics, but there is a general similarity between rape, robbery, and aggravated assault in the NCVS and the same crimes measured by the FBI.
Figure 2 shows the estimated violent crime rates for rape, robbery, and aggravated assault as measured by the FBI and NCVS between 1993 and 2023. The FBI rate for violent crime (rape, robbery, aggravated assault) known to the police has decreased about 23 percent since 2000, from 5.01 violent crimes per 1,000 population in 2000 to 3.86 violent crimes per 1,000 population in 2023 (the decrease from 2022 to 2023 was about 3 percent).
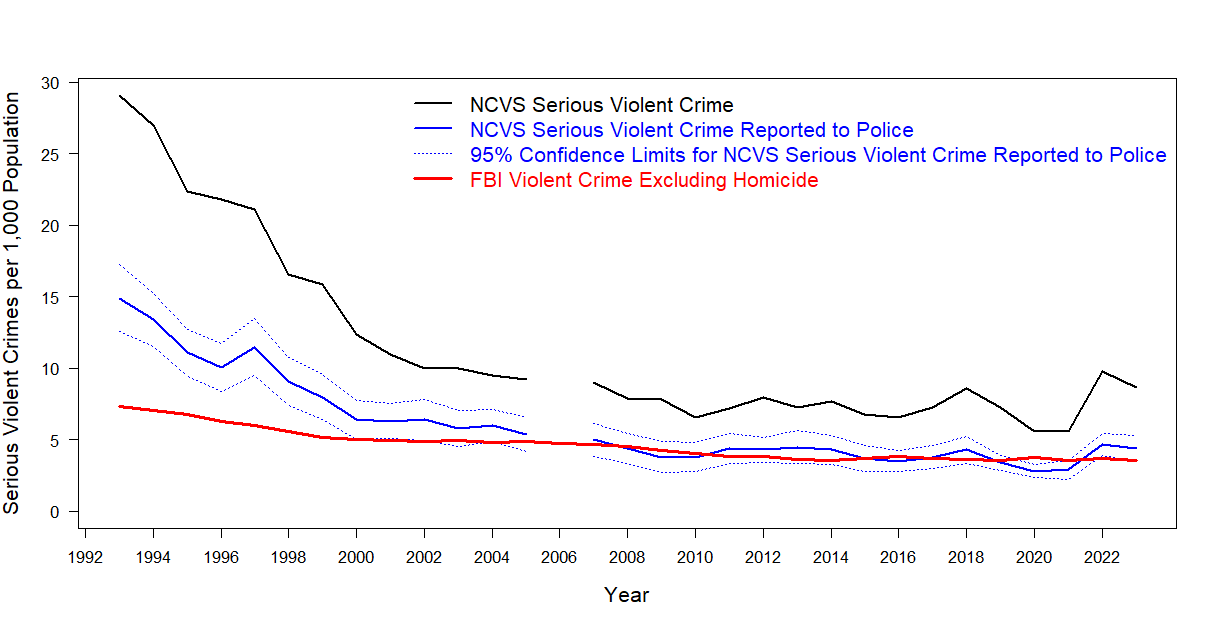
Figure 2. Rape, robbery and aggravated assault as measured by the FBI and in the NCVS. The NCVS statistics for 2006 are deemed unreliable (Tapp and Coen, 2023) and are not displayed. See the Data Sources section for comments on how these statistics are calculated and how the pandemic may have affected the NCVS statistics in 2020 and 2021.
The NCVS rate for rape, robbery, and aggravated assault (traditionally called “serious violent crime” in the NCVS) reported to the police shows more fluctuation from year to year. Some of that fluctuation occurs because the NCVS statistics are computed from a sample of households; the dotted lines in Figure 2 show the 95% confidence intervals for crimes reported to the police that reflect the variability due to sampling. While the changes in serious violent crime (for all serious violent crime and for serious violent crime reported to the police) between 2022 and 2023 are not statistically significant, the NCVS statistics for serious violent crime in 2023 are about 30 percent lower than in 2000 and are close to their 2019 (pre-pandemic) levels.
For most years since 2000, the rate of rape, robbery, and aggravated assault from the FBI statistics has been close to the NCVS rate of serious violent crime reported to the police. Note that this similarity has occurred even though some population groups are not surveyed in the NCVS. The NCVS does not measure victimizations of children under age 12, people in prison or nursing homes, people experiencing homelessness, or US nonresidents such as tourists. Crimes occurring to all of those groups are included in the FBI statistics.
Violent Crime 2023
The FBI and CDC statistics both indicate a large drop in homicide between 2022 and 2023. The decrease in serious violent crime between 2022 and 2023 is smaller; about 3 percent from the FBI statistics. We cannot say that the NCVS crime rates dropped from 2022 to 2023 because the difference is not statistically significant, but the trend is encouraging. Both the NCVS and FBI rates for serious violent crime, however, are close to the record lows for those series of statistics.
Copyright (c) 2024 Sharon L. Lohr
Footnotes and References
*The Crime Data Explorer main webpage (screenshot in Figure 3) states that the reduction in homicide from 2022 to 2023 is 11.6 percent but does not say whether this is a reduction in the number of homicides or in the homicide rate. Table 1 of the linked source data makes clear that the 11.6 percent drop is for the number of homicides (estimated to be 21,781 in 2022 and 19,252 in 2023), since (21781 - 19252)/21781 = 0.1161. The drop in the rate of homicides (number of homicides per 100,000 population) equals (6.54 - 5.75)/6.54 = 0.1207, or about 12.1 percent. Although Figure A.1 states that these statistics are from April, they are part of the September 23 data release; April was the cutoff for agencies to submit statistics for the 2023 annual report.

Figure 3. Screenshot of Crime Data Explorer main webpage taken September 28, 2024.
**In last year’s post, I commented that the difference between the two sets of homicide statistics widened in 2021 and 2022 compared to previous years. That wider difference has persisted for 2023, with the CDC rate being about 16 percent higher for 2023 than the FBI rate. I am not aware of any change in death or crime definitions that would account for this widening, but it is possible that the CDC’s vital statistics modernization efforts, which include quality improvement of electronic death registration systems, have resulted in more accurate cause of death classifications.
Catalano, S. (2016). Interviewing Conditions in the National Crime Victimization Survey, 1993–2013. NCJ 249682. Washington, DC: Bureau of Justice Statistics.
Krueger, F., Farber, J., and Hornick, D. V. (2024). Source and accuracy statement for the 2023 National Crime Victimization Survey. In National Crime Victimization Survey 2023 User Guide. Ann Arbor, MI: Inter-University Consortium for Political and Social Research.
Larsen, L.J., Lineback, J.F., and Reist, B.M. (2020). Continuing to Explore the Relation between Economic and Political Factors and Government Survey Refusal Rates: 1960–2015. Journal of Official Statistics, 36(3) 489-505.
Lohr, S.L. (2019). Measuring Crime: Behind the Statistics. Boca Raton, FL: CRC Press.
National Academies of Sciences, Engineering, and Medicine (2023). Toward a 21st Century National Data Infrastructure: Enhancing Survey Programs by Using Multiple Data Sources. Washington, DC: The National Academies Press.
Tapp, S. N. and Coen, E. J. (2024). Criminal Victimization, 2023. NCJ Report 309335. Washington, DC: Bureau of Justice Statistics.
Data Sources
The CDC homicide rates for years through 2021 came from https://www.cdc.gov/injury/wisqars/fatal/index.html; the provisional rates for 2022 and 2023 were obtained from https://www.cdc.gov/nchs/nvss/vsrr/mortality-dashboard.htm.
I downloaded Uniform Crime Reports (UCR) data from the FBI Crime Data Explorer on September 28, 2024. To download the tables of national estimates from the UCR, go to the main webpage of the Crime Data Explorer, then click on “Documents & Downloads.” Scroll down to the section “Crime in the United States Annual Reports” and download the CIUS Estimations data zip file. Table 1 contains the crime statistics from 2004 to 2023. Note that the FBI updates statistics as more data come in, so graphs in this post may differ from my previous writings. For example, the 2023 file lists a violent crime rate of 376.5 violent crimes per 100,000 population for 2017; Crime in the United States 2018 listed a rate of 383.6 for 2017.
For 2023, Table 1 lists 1,218,467 violent crimes (including homicide) and 19,252 homicides, giving rates of 363.8 violent crimes and 5.7 homicides per 100,000 population. Tables 4 and 5 of “Crime in the United States” give the estimated total amounts of crime in each state. Arizona had an estimated 30,383 violent crimes including 442 homicides in 2023, giving estimated rates of 408.8 violent crimes (including homicide) and 5.9 homicides per 100,000 population. The estimates for 2022 have been revised to 32,835 violent crimes (446.2 per 100,000 population) and 517 homicides (7.0 per 100,000 population), so the Arizona statistics show an estimated 11.6 percent decrease in violent crime overall and a 15 percent decrease in homicide from 2022 to 2023..
Descriptions of how the FBI statistics are calculated are given in “UCR Summary of Crime in the Nation, 2023” and “Crime in the Nation FAQs, 2023” found in the Special Reports section of the Crime Data Explorer. Statistics that are provided through the National Incident-Based Reporting System (NIBRS) are converted to the older Summary Reporting System format, and then the estimated crime totals are weighted using essentially the same procedure that has been in place since 1958. The methodology report in the Crime in the United States zip file download tells how crime statistics for nonsubmitting agencies were estimated:
Tables 1 through 5 and Table 7 of this publication contain statistics for the entire United States. Because not all law enforcement agencies provide data for complete reporting periods, the FBI includes estimated crime numbers in these national presentations. The FBI estimates data for three areas: Metropolitan Statistical Areas (MSAs), cities outside MSAs, and nonmetropolitan counties. The FBI computes estimates for participating agencies not providing 12 months of complete offense data. For agencies supplying 3 to 11 months of offense data, the national UCR Program estimates for the missing data by following a standard estimation procedure using the data provided by the agency. If an agency has supplied less than 3 months of data, the FBI computes estimates by using the known crime figures of similar areas within a state and assigning the same proportion of crime volumes to nonreporting agencies. The estimation process considers the following: population size covered by the agency; type of jurisdiction, e.g., police department versus sheriff’s office; and geographic location.
In 2013, the FBI revised its definition of rape to include male victims and additional forms of sexual assault, which added about 40,000 crimes per year. Figure 2 shows rates calculated using the legacy rape definition statistics for all years. The FBI line moves almost imperceptibly upwards if the revised definition is used for 2013 through 2023; the 40,000 crimes added from the revised definition represent only about 3 percent of the total violent crimes.
The Crime Data Explorer has other sets of numbers for crime statistics elsewhere on the website. Some of these do not account for missing data from nonsubmitting law enforcement agencies and thus should not be cited as statistics for the amount of crime. The “official” crime statistics are those in the “Crime in the United States Annual Reports.” These have two small differences from the statistics in the Documents & Downloads file “estimated_crimes_1979_2023.csv.” Table 1 calculates the total number of violent crimes using the “legacy,” pre-2013 definition of rape while the file estimated_crimes_1979_2023.csv calculates the total number of violent crimes using the revised definition of rape adopted in 2013. The file “estimated_crimes_1979_2023.csv” is also missing the US crime totals for the years 2017 to 2020.
The crime statistics given in the Data Discovery Tool of the Crime Data Explorer differ from those in the downloaded files in Table 1 of “Crime in the United States” and “estimated_crimes_1979_2023.csv.” The FBI does not list the source of the Data Discovery Tool statistics. See my 2023 post for information on the statistics in the Expanded Homicide Tables and the NIBRS Estimations of the FBI Crime Data Explorer.
The FBI statistics for 2021 were based on a different procedure than those for other years. In 2021, the FBI required all law enforcement agencies to submit data through NIBRS, and only about 65 percent of the population was covered by agencies that submitted data. Among the nonsubmitting agencies were police departments in several of the nation’s largest cities including New York and Los Angeles. For the 2022 and 2023 statistics, the FBI allowed agencies to submit statistics either under NIBRS or the previous system used for reporting, so the 2022 and 2023 statistics are directly comparable to those from 2020 and previous years, and data were obtained directly from all city agencies covering 1 million or more inhabitants for 2023. In 2023, the FBI issued revised estimates for 2021 that obtained data for some of the non-NIBRS-submitting agencies for that year, and the 2021 estimates were revised again in the 2024 data release.
The FBI website statistics are dynamic, and they revise numbers from previous years as new information comes in. Most of the time, those revisions are minor, but the 2024 revision of the 2021 crime statistics is quite large. For example, Crime in the United States, 2023 reported 22,536 homicides for 2021; Crime in the United States, 2024 reported 21,462 homicides for 2021. The FBI has not responded to my query of why the 2021 number was reduced by more than 1,000 homicides.
NCVS statistics in FIgure 2 are from the annual publications Criminal Victimization. Tapp and Coen (2024) is the latest entry in this series. They can also be obtained from the N-DASH tool at https://ncvs.bjs.ojp.gov/Home.
The 2020 and 2021 statistics from the NCVS were affected by data collection disruptions due to the pandemic (see my posts on 2020 and 2021 crime statistics). The Census Bureau, which collects the data for the NCVS, could not conduct in-person interviews for several months in 2020. This meant that no data were collected from households scheduled for their first interview and that households and persons on their second through seventh interview could not be followed up with a personal visit if they did not participate in a telephone interview. Persons interviewed face-to-face, however, typically report more victimizations than those interviewed over the telephone (Catalano, 2016), which “may be due to the interviewing conditions or the composition of respondents” interviewed by telephone or face-to-face. The Census Bureau added some weighting adjustments to attempt to compensate for the missing face-to-face interviews, but it is possible that these adjustments did not fully account for the missing data.
Although the NCVS represents the best available national data about crimes not reported to police, the NCVS response rate has been decreasing in recent years. Krueger et al. (2024) write: “Despite the measures taken to reduce nonresponse bias, there may still be some amount of nonresponse bias that cannot be corrected without knowing the victimizations of the nonrespondents.” NCVS response rates in the early 1990s exceeded 95 percent; in 2023, only 67 percent of eligible sampled households participated in the survey and 82 percent of eligible persons in the responding households answered the survey questions, so the overall response rate for persons in 2023 was about 55 percent (Krueger et al., 2024).
The major cause of the decrease in NCVS response rate has been the dramatic increase in the NCVS household refusal rate since 2010. Larsen et al. (2020) reported that the NCVS had a refusal rate close to 3 percent until 2010. After 2010, however, the refusal rate began increasing rapidly, with 15 percent of eligible households refusing to participate in the survey in 2016 and 31 percent of eligible households refusing to participate in 2023 (Krueger et al., 2024). More research is needed on characteristics of households and persons that refuse to participate in the survey; one possibility would be to use multiple data sources as suggested in National Academies of Sciences, Engineering, and Medicine (2023).